FUN WITH MATHEMATICS : NETWORK MODEL GAMES

LEVEL 2: Exploring the networks we live in

Required mathematical skills: understanding of basic mathematical operations

You can play any of the following scenarios at home on your computer.
 
We also suggest trying the same scenario in a group environment on several computers where each player runs the same instance (a scenario with same parameters and configurations) of the game. This way you can collect and compare results, and draw interesting conclusions from the outcomes.

SCENARIO 1

A SMALL, CLOSELY CONNECTED GROUP

Imagine a household or a small classroom or an office.
 
In this social context a group of people spend their time together every day.  That results in a network where each member of the group is in close contact with everyone else in the group.
 
This kind of graph – where each node is connected to all other nodes is called a complete graph .
 
Our first introductory interactive game is played on a complete graph consisting of 6 people.

INTERACTIVE ONLINE GAME

This introductory scenario has a very simple sequence of steps that you need to follow by clicking on the highlighted button on each step.
 
On the first step you will be prompted to select the parameter K. That number (presented as a dice value ranging from 1 to 6) sets a chance of a person catching a virus from another infected person
 
Then  you will be prompted to pick the first infected node and to end the first turn.
 
After that you will run the rest of a game session in a loop (steps: trace, test, end turn) until the endgame conditions are met: no more newly infected persons in the network. 

1

2

3

4

5

6

7

You can play the game by clicking ‘Play This Scenario’ button.
You can also read the detailed game guide here.
If you play this scenario several times, you will notice that results differ due to chance. Here is a set of questions that you can try to answer.
 
Explore the parameter K: set its values from 1 to 5 and play the game at least 10 times for each K.
 
Observe the following:
For a fixed K, did the game end always after the same number of dice rolls or it varied?
Did you always end up with all nodes infected or some stayed healthy by chance?
Find the average number of dice rolls from different games for each K. How does this average number change with K?
Find the average number of infected nodes from different games for each K.
How does this average number change with K?

SCENARIO 2

EXPLOITING CLOSELY CONNECTED GROUPS

In our daily life we move from one closely connected group to another. For example: we spend a part of our day in a classroom, and another part at home with our family members. This results in a network where one complete graph (i.e., kids in classroom) is connected with other separate complete graphs (families at home).

In this scenario we explore how a disease can exploit this characteristic of such closely connected groups and spread quickly through them.

You can play this scenario as an interactive game, but this network is also one of the networks we suggest playing as an indoor activity game.

INTERACTIVE ONLINE GAME

You can play the game by clicking ‘Play This Scenario’ button.
 
Note: This scenario starts with one side-node as the first infected.
You can also read the detailed game guide here.
If you play this scenario several times, you will notice that results differ due to chance. Here is a set of questions that you can try to answer.
 
Explore the parameter K: set its values from 1 to 5 and play the game at least 10 times for each K.
 
Observe the following:
How many people were infected on average for each K?
How many steps it took to stop the disease spread? Compare this to the game with K=6
(100% change of infection).
Was there a difference in the spread of disease based on the selection of the first infected node?

SCENARIO 3

HOW ONE PERSON CAN INFECT MANY OTHERS

Imagine yourself on a bus, at a business meeting, or in a café. Suddenly one person close to you sneezes. It turns out this person was infected, and there is a high probability that they released infectious particles (viruses) attached to sneezed droplets into the air. In this situation, several people standing nearby, including you, are now potentially infected too.
 
In this scenario we look at a simple model of how one infected person can start multiple clusters of infection with just one infection spread incident.
The network has one central node: the “patient zero” who sneezed. People who were in the proximity of the patent zero went home after that. Their families are examples of complete graphs.
 
We explore how infectious disease exploits this network structure to spread very rapidly through a large group of people.

INTERACTIVE ONLINE GAME

You can play the game by clicking ‘Play This Scenario’ button.
 
Note: This scenario starts withcentral node as the first infected.
You can also read the detailed game guide here.
If you play this scenario several times, you will notice that results differ due to chance. Here is a set of questions that you can try to answer.
 
Play with the parameter K: set its values from 1 to 5 and play the game at least 10 times for each K.
 
Observe the following:
How does a chance impact the final number of infected?
Calculate the average number of infected nodes from different games for each K.
How does this average number change with K?
Discuss: what can a person in the center of this network do to reduce the spread of disease?

SCENARIO 4

HOW WE CAN MAKE A DIFFERENCE, PART 1

In Scenario 3 we explored a situation when one infected person induces multiple infection clusters by sneezing on a bus, in a restaurant, or at any other similarly crowded place.

However, this scenario could play out quite differently if we do not let sneezed droplets to spread freely from infected person’s mouth/nose. Or if other people do not let those droplets enter their body when inhaling. This can be partially achieved by wearing masks.

In this scenario we replay the situation from Scenario 3, but now the people involved in the first round of virus spreading wear masks.
We treat masks as 50% reduction on the probability of transmitting infection. This means that the base probability set by parameter K drops to K/2 if one person wears a mask during social contact or K/4 if both people in contact wear masks.

INTERACTIVE ONLINE GAME

You can play the game by clicking ‘Play This Scenario’ button.
 
Note: This scenario starts with central node as the first infected.
You can also read the detailed game guide here.

You can analyze this scenario in comparison with the previous scenario 3. Here is a set of questions that you can try to answer.

Play with the parameter K. Set it to 4 and play the game at least 10 times.

K=4 means that the probability drops to K=2 when during a social contact (represented by an edge between two nodes) wears a mask and to K=1 when both persons wear masks.

Observe the following:

What is the main difference between the ability of virus to spread in this case compared to scenario 3?
Calculate the average number of infected nodes. How does this average number differ from the results of scenario 3?

SCENARIO 5

HOW WE CAN MAKE A DIFFERENCE, PART 2

In Scenario 2 we explored how a disease can exploit closely connected groups to spread rapidly through some population. In this scenario we explore if masks can make a difference during the disease spread if they reduce the risk of transmitting the disease.
People are often confused by the fact that masks do not protect entirely when at the same time they are suggested as an epidemiological measure during some pandemics.
 
In this scenario we explore the impact masks can have on a closely connected group of people.
 
As in previous scenario we treat masks as 50% reduction on the probability of transmitting infection. reduction on the probability of transmitting infection. This means that the base probability set by parameter K drops to K/2 if one person wears a mask during social contact or K/4 if both people in contact wear masks.

INTERACTIVE ONLINE GAME

You can play the game by clicking ‘Play This Scenario’ button.
 
Note: This scenario starts with one side-node as the first infected.
You can also read the detailed game guide here.
You can analyze this scenario in comparison with the previous scenario 2. Here is a set of questions that you can try to answer.
 
Play with the parameter K. Set it to 4 and play the game at least 10 times.
 
Observe the following:
What is the main difference between the ability of virus to spread in this case compared to the previous scenario 3?
Find the average number of infected nodes. How does this average number differ from the results of Scenario 3?

BONUS ONLINE GAME

In this instance, instead of using random numbers ranging from 1 to 6,  you can play game session with random numbers ranging between 1 and 100 to better resolve changes in probability due to mask wearing.
 
For example, if you pick parameter K=80 (eighty percent of infection probability) masks will reduce this to K/2=40 and K/4=20.
 
You can play the game by clicking ‘Play This Scenario’ button.
 
Note: This scenario starts with one side-node as the first infected.
You can also read the detailed game guide here.
Play with different values of parameter K. Try a wide range of values (e.g., 40, 60, 80, 100).

Play the game at least 10 times for each K.
 
Observe the following:
Calculate the average number of infected nodes for each K. How does this average number differ?
What can you conclude about the relationship between wearing masks and the ability (probability) of a disease to spread through population?

SCENARIO 6

A WAVE OF INFECTION

We live in larger social communities than just small closely connected groups. Infectious diseases evolve thanks to the mathematics of disease spread in such larger groups. The survival of a pathogen (virus) depends on its ability to circulate through the population.

In this scenario we look at a disease spread through a larger group of people.

INTERACTIVE ONLINE GAME

You can play the game by clicking ‘Play This Scenario’ button.
 
Note: In this scenario you will be prompted to select the first infected node.
 
Explore how the game evolves if you select a node on the network’s outer edge or a node closer to the network’s center.
You can also read the detailed game guide here.
If you play this scenario several times, you will notice that results differ due to chance. Here is a set of questions that you can try to answer.
 
Play with the parameter K. Set its values from 1 to 5 and play the game at least 10 times for each K.
Play games with the first infected node on the network edge and then a node closer to the network center.
 
Observe the following:
How does a chance impact the final number of infected? Calculate the average number of infected nodes from different games for each K and the location of the first infected node.
How does this average number change with K?
How quickly disease spreads depending on the location of the first infected node?

SCENARIO 7

SOCIAL DISTANCING

When a deadly highly infectious disease starts to spread through a population, social distancing is often invoked as one of the key measures against its rapid spread.
 
Social distancing means that we change our behavior in such a way that the number of social contacts between people is reduced thus reducing the chance of a pathogen to ‘jump’ from one person to another. In a network we see this as a reduced number of edges (links) between nodes.
 
In this scenario we use the same number of nodes as in scenario 6, but with some of the edges (connections between nodes) removed.
 
Even in this reduced network the virus can reach everybody sooner or later.
The question we are exploring is how this disease spread differs from the previous, more connected network in scenario 6.

INTERACTIVE ONLINE GAME

You can play the game by clicking ‘Play This Scenario’ button.
 
Note: You will be prompted to select the first infected node.
 
Explore how the disease spread evolves in comparison to your results from the scenario 6. Use the same game parameters as you did in the  scenario 6.
You can also read the detailed game guide here.
Here is a set of questions that you can try to answer.
 
Play with the parameter K and the location of the first infected node as you did in scenario 6.
 
Observe the following:
How quickly the disease spreads now compared to scenario 6?
Is this difference the same if you choose the first infected node on the network edge or closer to the center of the network?
Why do we care how fast the disease spreads?

SCENARIO 8

WHEN TWO COMMUNITIES MEET

We live in our circle of friends and contacts. All such personal networks are connected to other networks, and  together they form a massive global network of contacts.
This is why an outbreak of an infectious disease can spread across the globe even though it starts at some remote place, far away from our network of immediate contacts.
 
As we saw in a previous scenario, one non-medical public health measure intended to reduce the spread of an infectious disease is to reduce the number of contacts between various clusters. For example: at a school, pupils within one class can keep contacts with their classmates, but measures can be introduced to reduce the number of contacts between two or more classes.
 
In this scenario we use the same number of nodes as in scenario 6, but some edges (connections between nodes) are removed.  This reduction makes two distinct communities (i.e. two different classes) visible. Unlike in the previous scenario those communities are now mutually connected by only two edges.
We explore how this reduction of contacts impacts the spread of disease.

INTERACTIVE ONLINE GAME

You can play the game by clicking ‘Play This Scenario’ button.
 
Note: You will be prompted to select the first infected node.
 
For the most insightful results select the first infected node on the outer edge of this network.
You can also read the detailed game guide here.
Here is a set of questions that you can try to answer.
 
For the most insightful results select the first infected node on the outer edge of this.
 
Observe the following:
How quickly does the disease spread now compared to the scenario 6?
How does the result differ from the scenario 6 for low values of K (1,2 or 3) compared to higher values (4, 5)?

SCENARIO 9

A TOWN OF 100 PEOPLE

In scenarios 6, 7 and 8 we explore different networks of contacts in small communities. But those are nicely structured networks that are easy to understand visually.
 
In reality, our networks of contacts are large and messy, with nodes (people) having different number of edges (contacts) to nodes spread all over the network.
 
In this scenario we use a more complex network with 100 nodes and more complicated structure of contacts (edges). This model is closer to real situations. We explore how this difference affects the spread of a disease.

INTERACTIVE ONLINE GAME

You can play the game by clicking ‘Play This Scenario’ button.
 
Notice how this network unlike ones in previous scenarios does not have a distinct “edge”.
This is because nodes have connections all over the network no matter their location.
You can also read the detailed game guide here.
Here is a set of questions that you can try to answer.
 
Play with the parameter K. Set its value from 1 to 5 and play the game at least 10 times for each K.
Use the same first infected node in all these games. Then try the same procedure with different node as the first infected.
 
Observe the following:
Calculate the average total number of infected and the total number of turns of game session. How do these numbers compare between different values of K?
Note the turn when the peak of the number of infected is reached and the value of this peak.
How do these numbers compare between different values of K?
For comparison, play one game with K=6. This is the maximum possible rate of infection (basically 100% chance of infection). How does results (number of infected, turns until the endgame…) compare to other values of K?
Notice the rapid rise of the number of infected at the beginning of the game. This is often called “exponential growth”. It lasts only a few turns here because the total number of nodes is small.

SCENARIO 10

UNMASKING THE MASKS

Wearing masks is recommended as a non-medical public health measure intended to reduce the spread of infectious respiratory diseases like Covid 19. Interestingly, mask wearing became a debated issue. More precisely, the ability of masks to make any difference at all is questioned. The confusion is understandable: masks are far from perfect protection and we know that they do not provide 100% security. So, why do we use them?

In this game set we test the idea that reducing the probability with mask wearing impacts the spread of disease. We use the same network as in scenario 9, but in this one we randomly picked a fraction of nodes and equipped them with masks represented by a small white circle.

We use a simple model to illustrate the mathematics behind masks: when two people meet, the chance of disease transmission between them drops by 50% if one of them wears a mask, and by 75% if both wear masks.
In other words, the probability parameter K is reduced by multiplication by 0.5 or 0.25.

INTERACTIVE ONLINE GAME

You can play the game by clicking ‘Play This Scenario’ button.
 
Note: In this game masks are used by 66% of all nodes.
You can also read the detailed game guide here.

Here is a set of questions that you can try to answer.

Play with the parameter K=4 (masks turn this into K/2=2 and K/4=1) and play the game at least 10 times for each K.

Use the same first infected node in all these games. Play scenario 9 games with the very same values of parameter K for comparison.

Observe the following:

Compare the numbers produced by scenario 9 and this one.
What difference do you see now in the trend of infected compared to the previous scenario (scenario 9) without masks?
Do you see nodes with masks getting infected? What do you conclude from that?

SCENARIO 11

VACCINATION – ONE FOR ALL, ALL FOR ONE

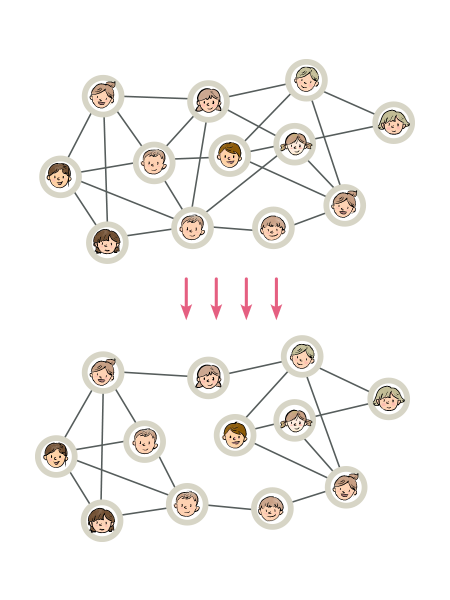
The biggest enemies of an infectious disease are immune people. If a disease encounters only immune people, it has no possibility of spreading so it dies out.
 
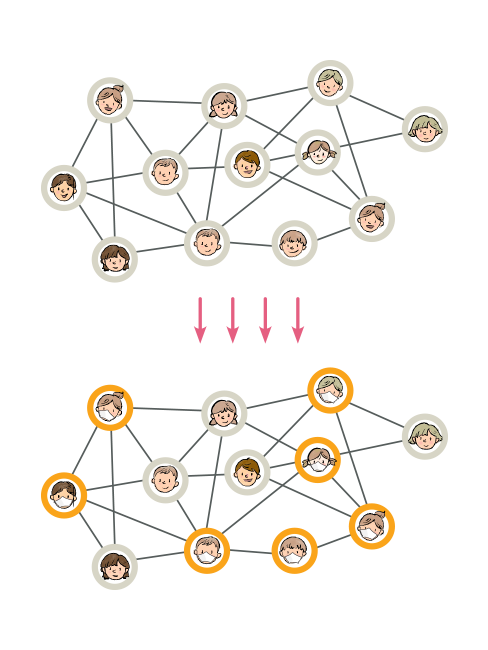
It is not necessary to have everybody immune for such disease stopping scenario to occur. For instance, some people have health conditions that prevent them from receiving a vaccine. Moreover, vaccines are not 100% efficient, which means that some fraction of the population will not develop disease immunity despite being vaccinated.
 
Mathematical modelling is important in this situations. Models can give us predictions and guides on how many people need to be vaccinated to stop an epidemic.
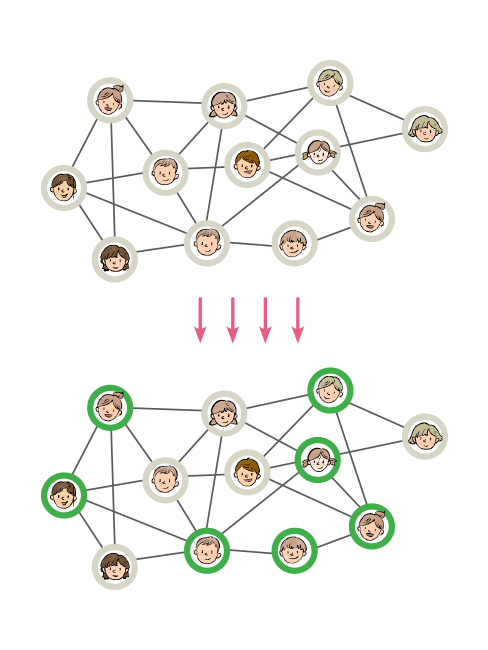
Models can also tell us if some groups of people should have a priority for vaccination. For example, health workers are always on the top of the list because they come very often in contact with infected people or they work with patients with fragile health conditions.
 
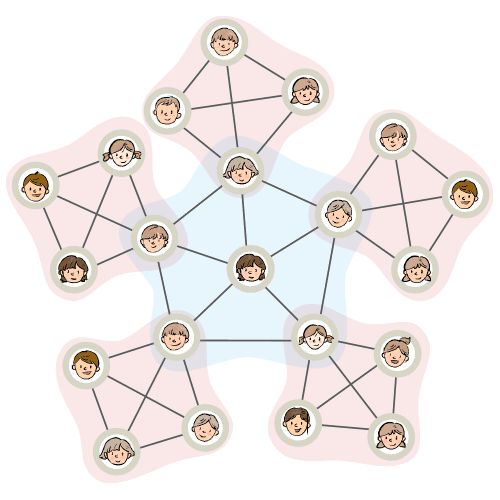
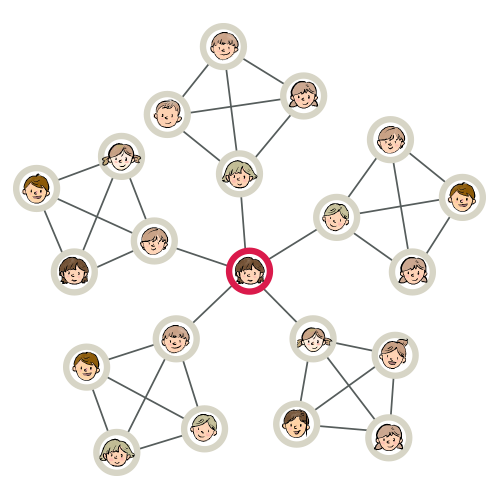
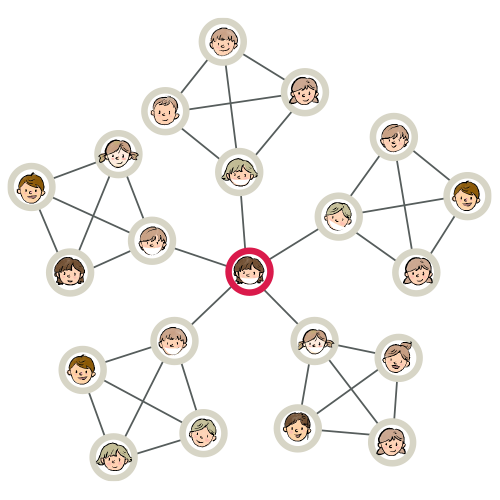
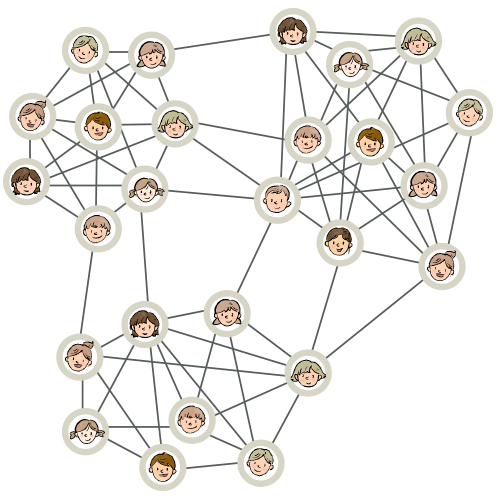
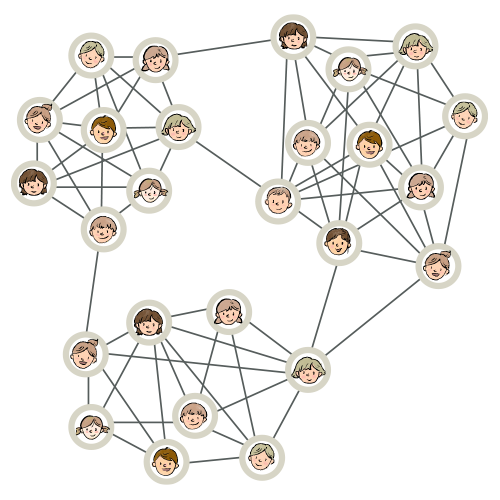
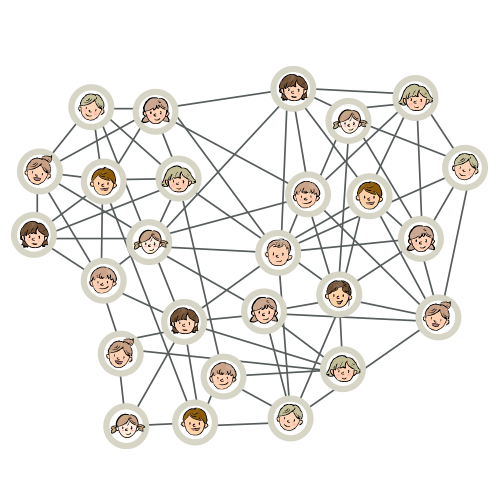
In this scenarios we explore how much impact immune population has on the spread of disease through our model town of 100 people.
In instances of this scenario we vary the number of immune network nodes. We urge you to compare this scenarios to spread through an unprotected community described in scenario 9.

INTERACTIVE ONLINE GAMES

You can play the game by clicking ‘Play This Scenario’ button.
 
Note: This scenario has 33% of nodes immune (successfully vaccinated).
You can also read the detailed game guide here.
You can play the game by clicking ‘Play This Scenario’ button.
 
Note: This scenario has 50% of nodes immune (successfully vaccinated).
You can also read the detailed game guide here.
You can play the game by clicking ‘Play This Scenario’ button.
 
Note: This scenario has 66% of nodes immune (successfully vaccinated).
You can also read the detailed game guide here.
Here is a set of questions that you can try to answer.
 
Play with the parameter K. Set its value from 1 to 5. Play each instance of the scenario at least 10 times for each selection of K. Play the game in scenario 9 with the same parameters of K for comparison.
 
Observe the following:
How does the spread of disease differ between scenario instances with the same values of K?
Is there a critical fraction of immune nodes required to stop epidemic for a given value of K?
How does the spread of disease differ between this scenario and the one in scenario 9?

Contact Us